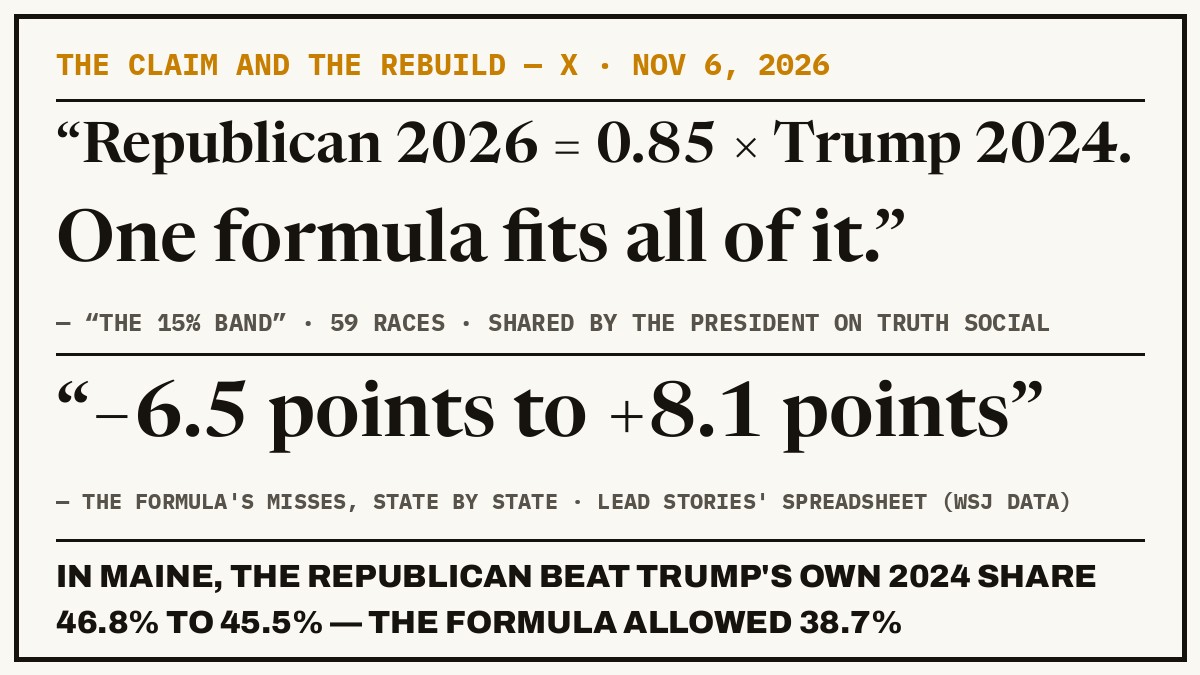
The “15% Band” said one formula fits 59 races. Rebuilt state by state, it misses in both directions — by eight points in Maine.
A post titled “THE 15% BAND” says the 2026 results follow one formula — Republican 2026 equals 0.85 times Trump 2024 — across 59 Senate and governor races. Lead Stories rebuilt the graph from the Wall Street Journal's 2024 and 2026 data and published its spreadsheet. A stretch of deep-red states does sit within about a point of the formula. Everywhere else the misses run in both directions: from 6.5 points under the formula in Rhode Island to 8.1 points over it in Maine, where the Republican Senate candidate beat President Trump's own 2024 share. The original graph's axis ran only from 20 to 80 percent, stretched wide — which is what makes the lines look fused.
By SmokeScreen Desk · Toronto
Published Nov 8, 2026 · 1:31 p.m. ET
🎧 Listen to this article
The post went up on X on Friday, November 6, 2026, from the account Truth is Freedom. Its title is “THE 15% BAND”, and its claim is a formula. “59 races. Senate and governor. One formula fits all of it: Republican 2026 = 0.85 × Trump 2024. Democrat 2026 = Harris 2024 + 0.15 × Trump 2024. For every 1,000 Trump points, 850 stayed Republican. 150 landed on the Democratic side.” The Gateway Pundit carried the claim the next day under the name the “85/15 Algorithm”, and President Trump shared the post on Truth Social on Saturday, November 7 — the amplifiers credited once, as this desk credits reach. The post closes with a demand and a concession in the same breath: “A pattern this even demands answers at the ballot level… The numbers raise the question. The ballots can answer it.”
What the claim asserts is narrower than “Republicans fell”. Republicans did fall, in nearly every state, against a presidential-year baseline. The claim is that the fall was mechanical — one multiplier, the same everywhere. “It didn't matter how red the state was. Wyoming, Ohio, Illinois, Massachusetts: same 15% (p = 0.69).” “Drop any single state and the multiplier stays between 0.846 and 0.853.” “Variation explained: 88%.” If a single constant truly generated 59 results, it would leave a signature no ordinary swing leaves: the same deviation, state after state, inside a point or two. That signature is testable, because every input is public.
Lead Stories ran the test, publishing its check today, November 8. It took the Wall Street Journal's 2024 presidential results and the Journal's latest reported 2026 Senate figures, recreated the graph, and added three states the original left out — Alaska, Arkansas and Montana. Then it did the thing that settles arguments of this kind: it published the spreadsheet, state by state, for anyone to download. This desk downloaded it and read the table: 32 Senate states, each with Trump's 2024 share, the formula's output, the Republican candidate's actual 2026 share, and the distance between the two.
Part of the pattern is real, and the spreadsheet shows where. A stretch of deep-red states — West Virginia, Oklahoma, Alabama, Kentucky, Arkansas, Tennessee, Mississippi — lands within about a point of the formula, and 8 of the 32 states sit within a single point of it. Seventeen land within two points. That is the half of the table the claim is built on, and it is genuinely there.
The other half is the rest of the table. The misses run in both directions. Rhode Island's Republican finished 6.5 points under the formula; Texas 4.9 under; North Carolina 4.2 under; Mississippi 3.6 under. On the other side, Oregon finished 3.5 points over the formula, Minnesota 3.7 over, Wyoming 3.7 over. The four states the post named as identical are not: Illinois misses by a tenth of a point, Massachusetts by 1.1 over, Ohio by 1.8 under, and Wyoming by 3.7 over. “Same 15%” is not what the post's own four examples show when each is run through the post's own formula.
Maine is where the formula breaks outright. Trump took 45.5 percent there in 2024, so the formula allows the 2026 Republican Senate candidate 38.7 percent. The candidate took 46.8 percent — 8.1 points above the formula, and above Trump's own 2024 share. A mechanical shave of 15 percent cannot return a number larger than the number it shaves. One state doing so does not prove anything about the other 58 races; it proves the constant is not a constant.
Two quieter points in the Lead Stories check explain how the picture persuaded. The original graph's vertical axis ran from 20 percent to 80 percent on a frame stretched wide along the horizontal, which presses lines that differ by five or eight points into looking close. Replotted on a 0-to-80 axis, the spread is visible. And the claim's load-bearing word is “average”: as Lead Stories puts it, the graph said Republicans kept a percentage of Trump's share “on average”, but “there would be such an average number whatever the result in any state was”. An average retention near 85 percent is what arithmetic returns whenever a party runs below its presidential year almost everywhere, by amounts that vary. It is a description of the results. It is not, by itself, a mechanism that produced them.
The check has limits, and they belong on the record. Lead Stories rebuilt the Senate half of the claim; the 29 governor races were not in its spreadsheet. Counts were still running in some states when both the post and the check were made, so individual figures will move at certification. What would settle the whole claim is the same test on certified numbers — the spreadsheet is public, the formula is printed on the post, and the test is repeatable by anyone, including the post's author.
So the file sorts the way this desk sorts every file. Documented: the post and its two formulas; Lead Stories' rebuild from the Journal's data, with the spreadsheet published; a deviation range running from 6.5 points under the formula to 8.1 points over it across the 32 Senate states; a cluster of deep-red states within about a point; and Maine's Republican finishing above Trump's own 2024 share. Not in the record: a fit within the claimed tolerance across the 59 races, a ballot-level document of any kind, and a checked version of the governor half. Claimed: by the post — that “one formula fits all of it”. Read the receipts. Decide for yourself.
Think we got this one wrong?
Good. That's the job — yours and ours. Bring your own receipts, and if you're right, the correction runs on this story, in the open, with credit.
Challenge this story